Guide 02
Build the Control Dashboard
The user should see the promise immediately: this isn’t just chat. It’s a control surface for an AI workforce, with visuals that explain each pane.
War Room View
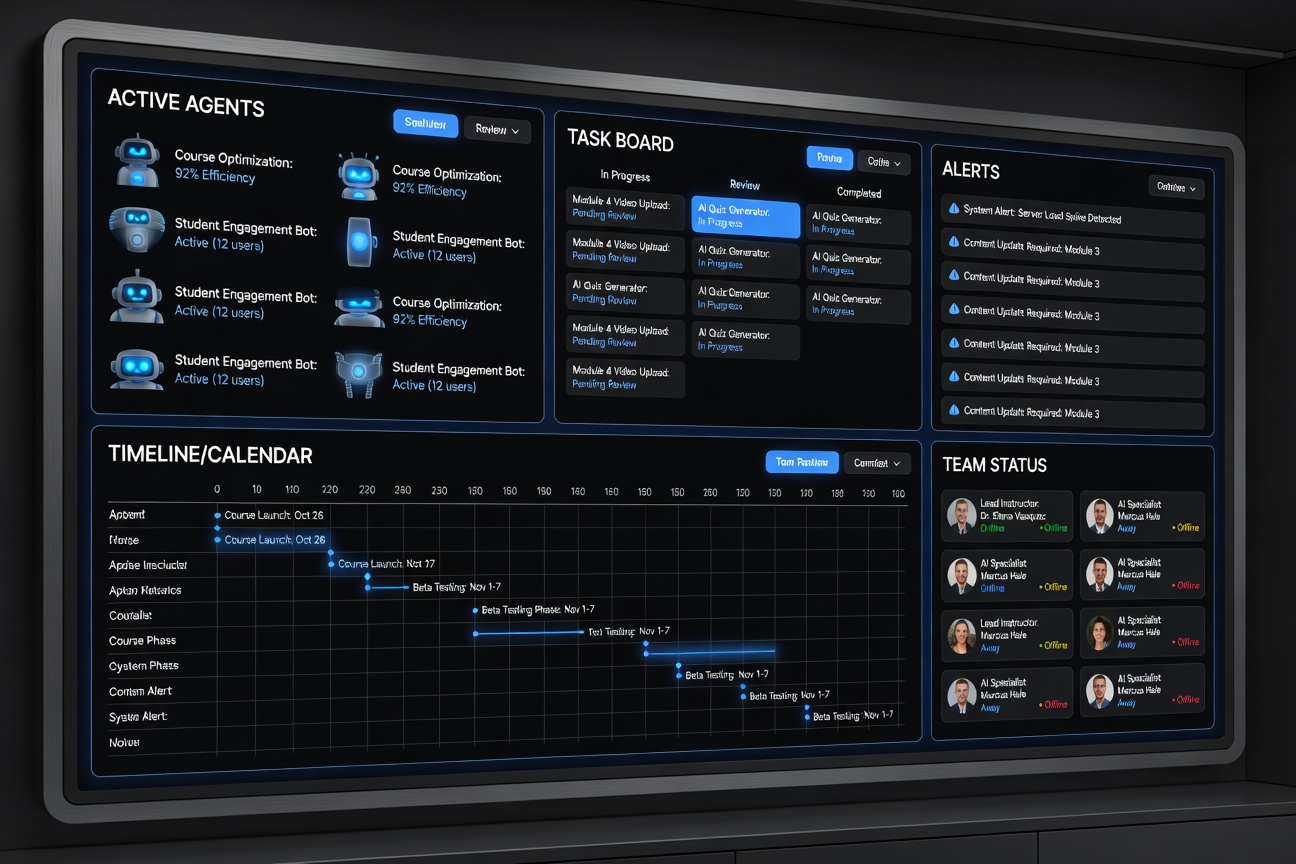
Show the command center first
The dashboard should immediately communicate active agents, task flow, timing, and where the human operator still needs to step in.
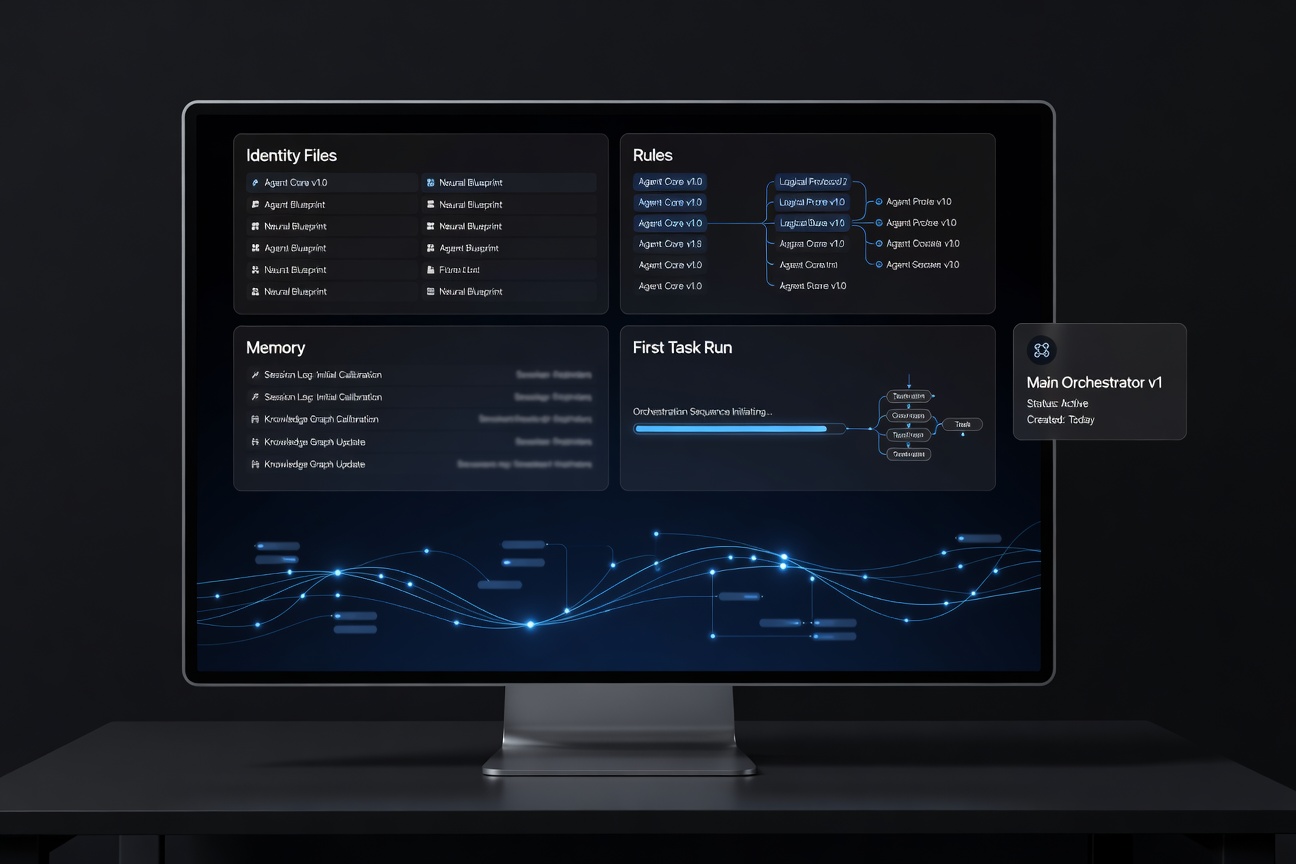
Dashboard Philosophy
The dashboard gives the owner one place to see active agents, work queues, timing, and team structure. That’s what makes the system operational rather than gimmicky.
Key Views
- Office: real-time visibility into active agents
- Tasks: delegation, status, and priority management
- Calendar: recurring automations and rhythm
- Team: org chart and capability map
What the User Should Understand
- What is running right now
- What is blocked or waiting for approval
- How tasks move through the system
- How the org chart maps to actual work
Preview Outcome
A user should be able to picture saying, “I want my own version of this.” That’s the job of this member guide and the supporting visuals.
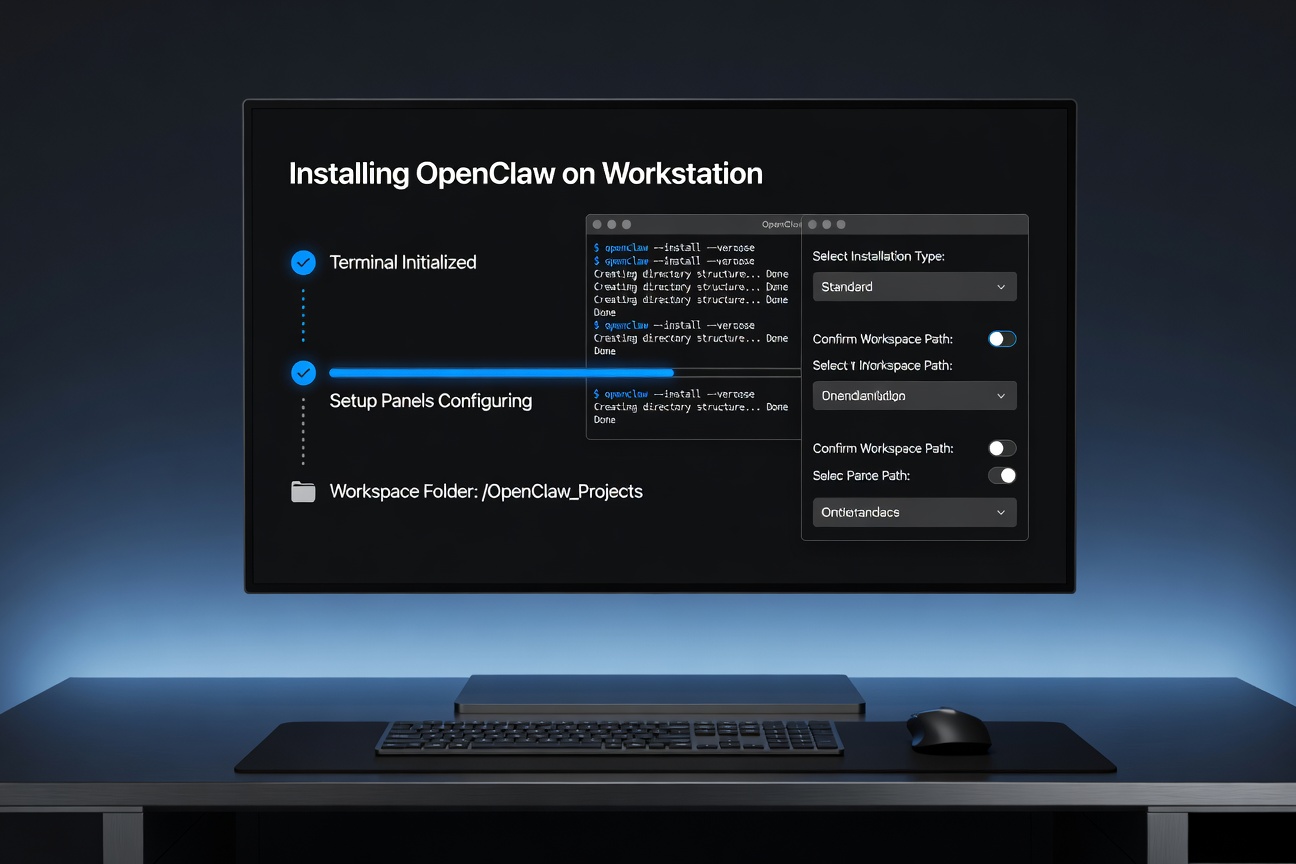
Before the Dashboard: Terminal Proof